Firstly I will say that having a "Smart" trainer has meant that I have ridden the turbo a lot more than I ever did on my original "dumb" unit - having a means of defining some form of structured work out and getting specific measurables has really been an improvement and I rode hundreds of miles on the turbo over the initial 3-4 months ownership. Needless to say the good weather then saw it relegated to collect dust again but its back out now and in use.
As I noted in the earlier post I used either VeloReality (Veloreality) or Road Grand Tours (RGT) (https://www.roadgrandtours.com/). Both different but both providing a means of training. In the case of Veloreality I use it very much as a structured training aid by defining a power/time profile, whilst Road Grand Tours is more of a video game approach where you can ride up some famous virtual climbs (Stelvio for example). I have not tried what appears to be the all encompassing Zwift yet however and I think RGT will struggle to break in to the market against Zwift. Over the summer RGT added a number of updates including a flat Criterium circuit and also scheduling races very much as per Zwift
However my perception of riding the trainer at a given power level felt a lot harder than on the road at the same power level. This is very difficult to quantify as its perception. Now that the good weather is over I have decided to analyse this slightly more scientifically. Given I have 2 power measuring devices and a means to record the same ride on 2 devices (a Garmin and Veloreality) I have started some vaguely analytical tests.
Here is the result of the first ride - very much a turn up, ride bike and collect data event. Here's the data:
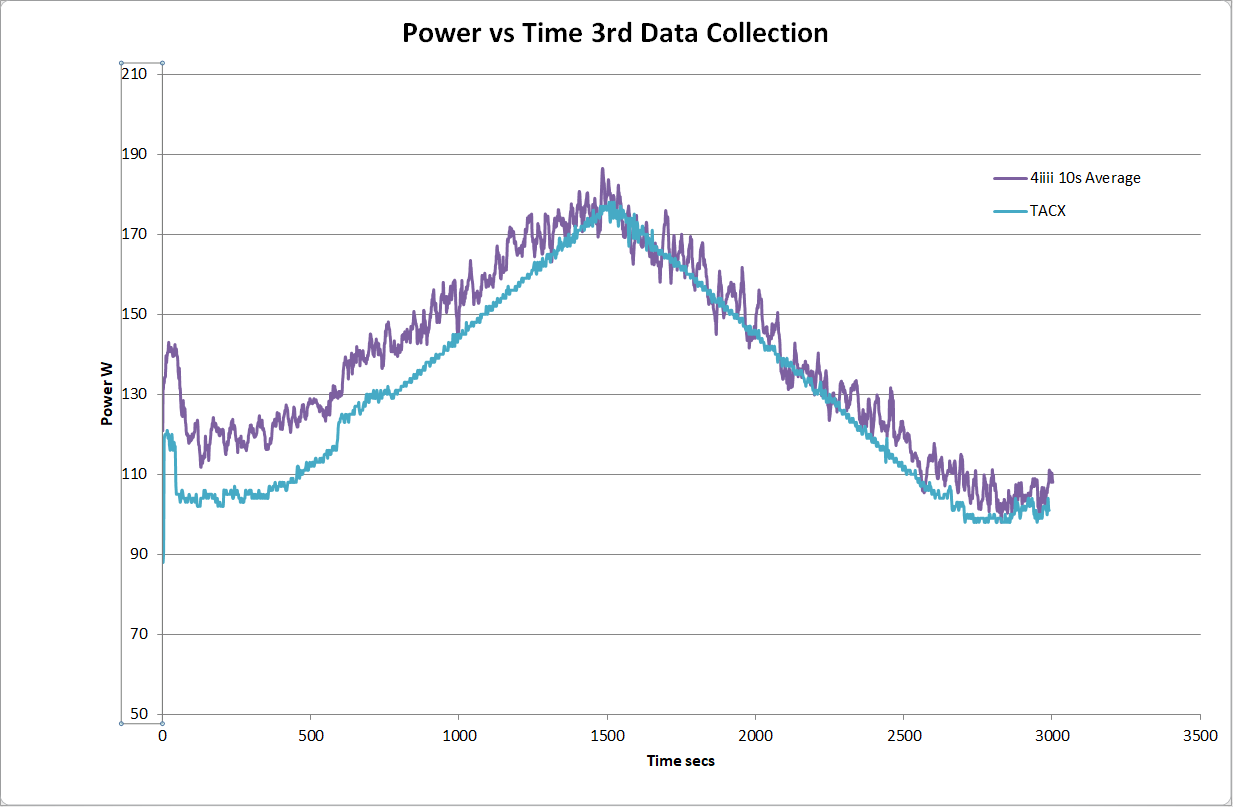
This graph shows the difference between the 2 power meters vs. time:

The error is fairly consistent against time. There is an odd error at ~1800secs that is not seen elsewhere.
Here is the same data (note that the 4iiii data is a rolling average over 10 seconds) plotted against each other, allowing the relationship between the two data sets to be assessed
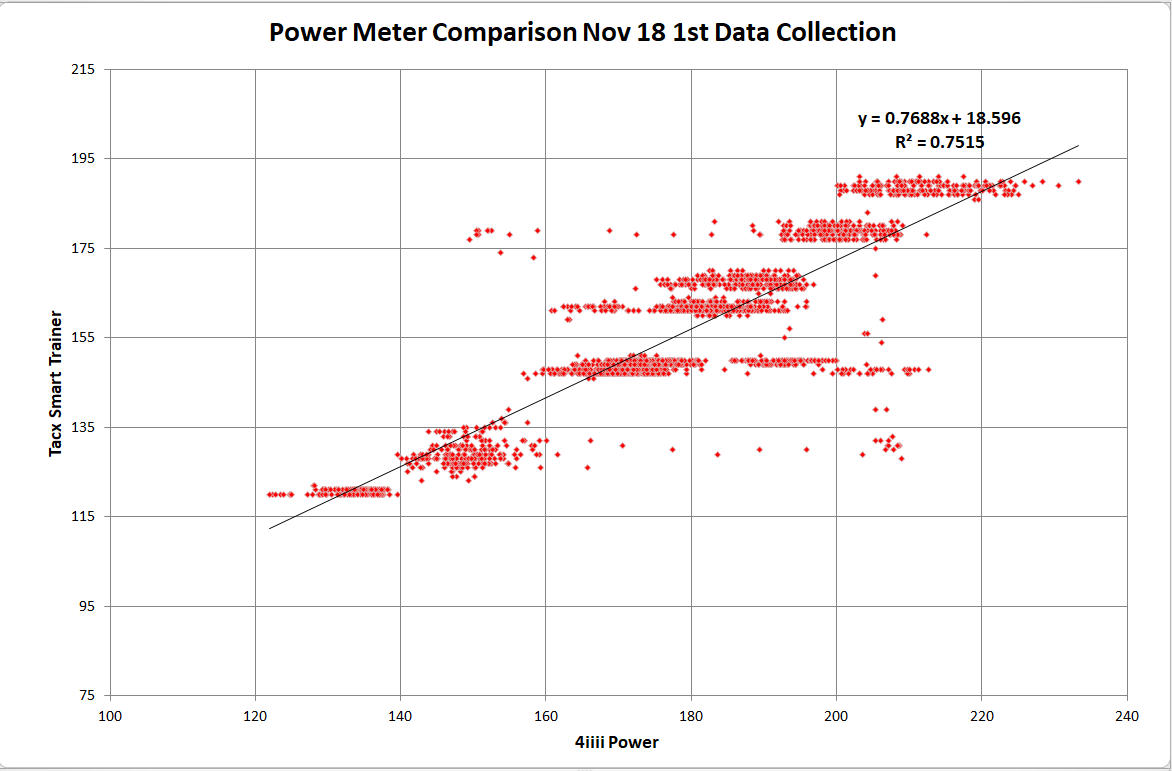
What is seen here is a reasonable correlation (although 75% R2 is not great) and the linear curve fit shows that the Tacx meter reads 18Nm lower than the 4iii meter.
This offset ties in with the perception that the power reads lower on the Tacx.
I then collected a 2nd set of data a week or so later (a different test cycle to the first):

In this Graph we see that the 4iiii power meter read a lot higher at the start of the ride although this difference starts to reduce as the first ramp is approached. It can also be seen that at the end of the ride that the difference has reduced. This behaviour is different to the first ride which shows a constant offset.
In order to show this more clearly here is a plot of the error vs time:

This shows clearly the convergence of values over time.
Using the same approach the correlation between the 2 meters was plotted:

This is a much better correlation than the first (R2 = 0.88) although the offset is bigger at 39 - this is strongly influenced by the initial offset I believe.
In both these cases it was a case of turn up and ride and collect data to understand what the problem might be. This leads to many issues.
A third experiment was then carried out. In this I rode an easy warmup for ~5 minutes before starting any measurement.
Additionally I completed a calibration of both the 4iiii meter and Tacx before data collection.
In the case of the 4iiii this is a "0" rather than a calibration - whilst unclipped and with the crank arms vertical use the calibrate process either from the 4iiii Mobile App or via the Garmin.
For the Tacx it needs a coastdown test. In this instance it failed the first time so I spent a number of iterations using the app to get the result to be exactly half way between "too loose" and "too tight" I still don't quite understand how this is a calibration.
The data is here:
The power/time plot for this activity shows that by about half way through the session the error between the two power meters is quite small and this smaller error is maintained for the rest of the ride. This is clearer here:

The error has dropped to about 5W (4iiii still reading higher). This is pretty acceptable given the quoted accuracies of the 2 devices
Following this further here is the correlation data for the full ride:

On this occasion we have got a 92% R2 value (this is pretty good) and a zero offset of 15W. The data shows this is primarily at the start of the ride so I performed the came correlation for the 1st half and the 2nd half of the ride, here:


For the 1st half: 96% R2, 36W offset, and the 2nd half: 97% R2 and 11W offset
This result for the 2nd half of the ride is pretty impressive. I believe that the error has reduced as the TACX unit has warmed up, although this is not seen in the other 2 rides. It would be challenging to have to ride on the turbo for 20-25 minutes before starting the proper ride in order to get reliable result
As a bit of additional reading DC Rainmaker has a recent post (Decemeber 18) here about a similar (the same?) topic: dcrainmaker.
I don't agree with everything he says (especially about accuracy) but he sees lots of product and has time to collect data and analyse it and there is a lot of interesting information
(More comment to be added - 20 Dec 2018)