Please use this version
Update of an Update:
I have been working through the issues seen when running the application standalone - ie outside of the debugger/IDE. As a consequence I now have a logger implemented in most areas which has resolved a number of the issues - ie it should run without too many Exceptions as I have trapped them or fixed the code. However there are still a number left and there is more work to do here - I realise that I should have done this sooner
It is however good enough to have another go at a release which is here:
Bristow Strava dot net app V2_1_1_0_34
I have made a few changes since the post below but apart from the logos and the icons its all been about error fixing
Note the log file is called "Traceoutput_yyyy_mm_dd-hh_mm_ss.txt" and can be found in the data folder from the menu option
Update
I believe some people are interested in this - it gets a reasonable amount of traffic. Whether people use the tool or not I am not sure as there has been very little communication about it, but IO have continued to plug away and add more feature. I had a bit of a break with other priorities but have had some time recently
This post will also show what's coming up - I was going to release the latest build with this post but when I published it it crashed all over the place (unlike the previous release in December) so I need to do some more testing
Here is a list (in oldest order) of all the pages I have prepared for this application. Please read in this order as the text does describe the application etc and how to use it - especially how to create the Strava token that you need to get either the Public or the Private data
Here is some description of the newer features that have been developed:
Main (default) tab
Added some further Athlete data both tabular and graphical. It shows in a table the annual data summaries for number of rides, and total distance, elevation and time ridden. This is also presented graphically. It also details for each bike and the total, and the distance each has done.

Ride Activities tab
Activities for which the data has been downloaded to the local PC are now shown in red:

Ride Activities Statistics tab
Enhanced tabular and graphical views
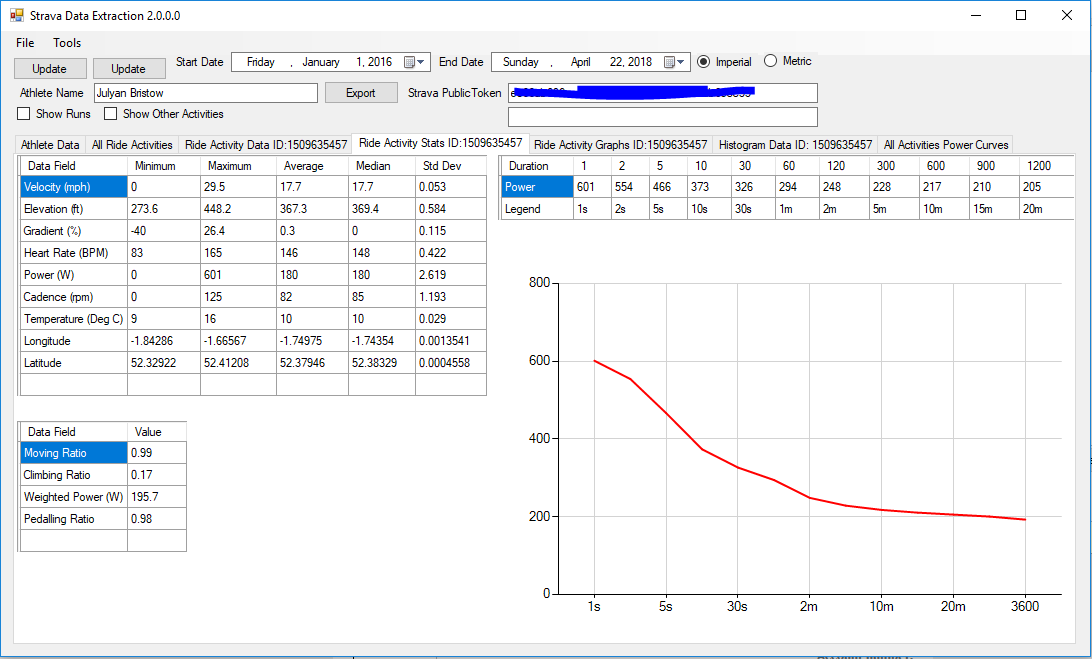
There is a table for some more enhanced statistics - the "Dr Coggan" power number (if have a power meter) and moving, climbing and pedalling ratio (%age of the total ride time). Some of these come from Veloviewer and some from the StravistiX plug in for the Chrome Browser
Ride Activity Graphs tab

The slider next to the data table allows the graph height to be increased or reduced

Clicking and holding the mouse over an area of the graph will zoom the x-axis over that region
Histogram tab
New - shows distribution of data points. Will show Speed. Power (Power Meter data only), Cadence, Heart rate, Temperature and gradient. If any of the data is not present the histogram will not be presented. Dependant on the number of histograms to plot the size and position will vary to give the biggest/best view
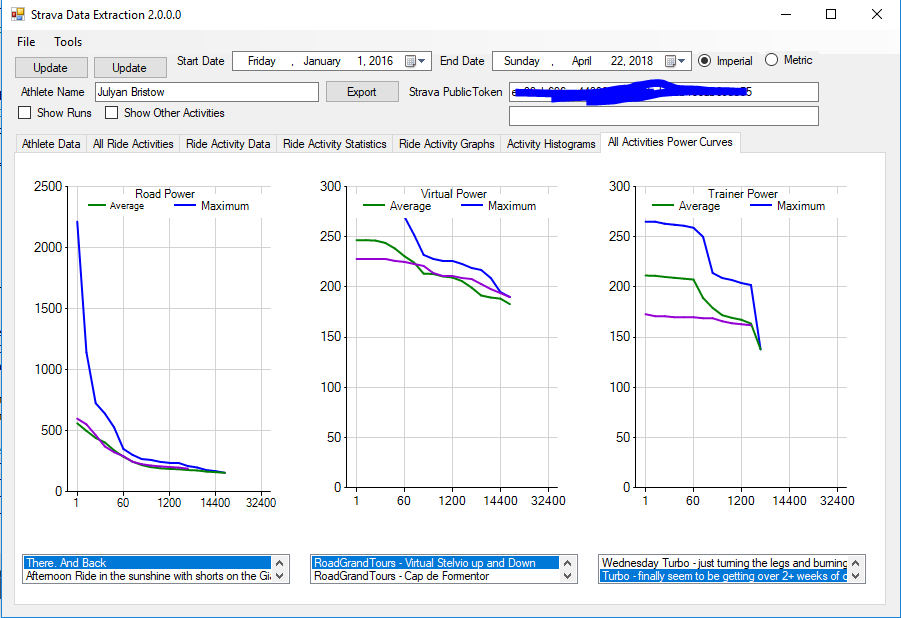
All Activities Power Curve tab (Power meter data only)
If you have a power meter (or a smart turbo that measure power) this will present the data n 3 graphs - one for road, one for "classic" turbo and one for virtual rides (like Zwift etc)
Next Steps
I have a list of enhancements to make, but clearly to get it to work when published seems pretty important first
Once this is achieved next improvements and features include:
- Adding manual data (like FTP)
- Seeing what else is available as a Premium member (I am not one)
- Adding a system logging process (so I can understand when and what issues occur when not running in the IDE) (in progress May 2018)
- A lot of code tidying - the more I write the more I see where I can make improvements (has started as part of #4)
- Some more statistic calculations
- The most important step now is I think to move the data from flat files into a proper database - this is now essential as there are potentially 4 files per activity plus a growing number of application summary files. This in elegant and I can see how using a data base will help manage and use the data. I understand the database process and strategy but I have never done this so it will be a major challenge
- Add code to manage the data usage for the API and pause when the limit is close
- Allow the system to update since the most recent update and add the new data to the existing data set rather than refresh the entire data set in the selected range
- Really try and manage the process to get a Token within the application - the current process is dreadful (although fortunately its a one off task generally)