Showing posts with label Strava C# application. Show all posts

Sunday, 20 June 2021

Strava Data Analysis Tool - sort of Version 4.x

First 2021 Update

Since the better weather arrived in April 2020 I have spent a bit more time cycling than tweaking my Strava Data Analysis Tool. However I am always making a few updates in the background and over the past few months I have made a number of changes making it worth issuing an update

You can get the update here: Link - Strava V4 - Full Installer.zip

The main changes are as follows:

  • Some improvements to the GUI and redrawing the various tab pages when selected
  • Some minor error fixes
  • GUI improvement with an informational form popping up when downloading the Ride Meta data (which is a single long operation and I can't report and form of % progress)
  • Many minor tweaks and changes that I have forgotten about due to poor tracking

I am the limit of the features that I had thought about implementing and there are very few left to do

I need to revisit the Authentication code which now does not seem able to re-authenticate automatically

I also want to integrate my fit file reader and tcx reader code into the same application so that if you don't use Strava but do have a device that creates fit or tcx file you can still use the tool and get the data and analysis 

Next steps are I think a "start from nothing rewrite" and implement all the coding learning I have made over the past 2 years  - I now know that I need to plan better, and split the code into more smaller classes that are easier to manage. I'd also like to look a optimising some of the code - there are bits that seem to take ages when I think about what they are doing. I appreciate that looping through tables of data with 1000's or rows will have a performance impact but it seems 

It's become a huge code base that's all intertwined and it takes a lit longer than I know it should to make changes as it's hard for even me to follow - and I wrote it!

See previous posts for instructions here:

Post 1 - Posted 11 December 2016
Post 2 - Posted 7 January 2017
Post 3 - Posted 4 December 2017
Post 4 - Posted 22 April 2018
Post 5 - Posted 25 April 2019
Post 6 - Posted 4 May 2019
Post 7 - Posted 15 June 2019
Post 8 - Posted 6 March 2020
Post 9 - Posted 15 March 2020
Post 10 - Posted 29 March 2020

You can see here the erratic nature of my development pace!

Sunday, 31 January 2021

ZWIFT - I Gave in and Tried It

I have had a turbo trainer for a long time - initially a simple "dumb" unit (a Tacx that I sold on EBay lst year) and a few years ago my wife bought me a Tacx T2240 Flow trainer which I actually used a lot more

Tacx 2240 Flow

I used Road Grand Tours (RGT), and also Velo Reality (here) a simple trainer app that allowed you to create workouts (power as a function of time):


After a Lockdown Summer in 2020 and good weather that ran all the way through to late September I'd not needed to even think about riding the turbo, but as the nights drew in and the weather got worse there was really no option. After a few final attempts I gave up on RGT as I could never connect using the Android app and if you can't connect you can't ride. Even when I was on RGT earlier in the year it was fairly empty to be honest, so I deleted the app from my phone and uninstalled from the laptop, leaving me with just the Velo Reality training application. I tried to make the sessions in the garage less tedious with a second monitor on my laptop so I could watch Netflix whilst riding but it was, to be honest, soul destroying

As a result, in a moment of weakness I had a go with the free 1 week trial of Zwift. I was really reluctant to start paying especially as I knew I'd barely use it in the Summer. 

However what a revelation! It was incredibly involving, lots of people to draft and pass, a variety of "routes" and scenery. Within the first 3 rides I had shed my financial inhibitions and signed up - even at £12.99/month

Clearly there are many other sites about what Zwift is so I won't bother covering that ground again. 

For me the main thing is that it has, with no doubt made me fitter and stronger. I've ridden a combination of solo free rides, I've ridden in a number of meetups with other and I have ridden some of the more formal Zwift events (Fondos and Tour de Zwift) for example. Most of the time I have tried to push myself to an extent and I have seen the average power per ride creep up from around 160-170W at the start of November 2020 to just under 200W by mid January 2021. I have also moved my Zwift FTP from an initial measure of ~170W to 234W on an ascent of Alpe du Zwift (aka a virtual Alpe d'Huez - and averaging 240W for an hour on the big climbs. Whilst I am pushing more power on the flatter sections I still can't manage the level and duration on the climbs

To try and get some real data to prove if this perception of increased power since I started using Zwift, I used my Strava Data Tool to download my data and exported the ride summary data to Excel:


This tab of my tool is the Summary data

In Excel the graph of Power (Average Watts for the ride) looks like this


I have filtered out the rides with power <150W as these are mostly warm up and cool down rides. Anything above 150W means I am at least making at attempt and some effort. The data is pretty variable and reflects that at times I've probably been a bit fatigued. The 2 biggest average power rides are both an attempt at Alpe d'Zwift - the ride giving me an FTP of 234W.

I've added a linear trend line to the data which shows an increase of average power from around 165W at the start of my Zwift riding to around 190W as of the end of January 2021. This data certainly supports what I feel I can do. The R2 of the curve fit is pretty low however reflecting the high level of variability in the data so some caution must be used

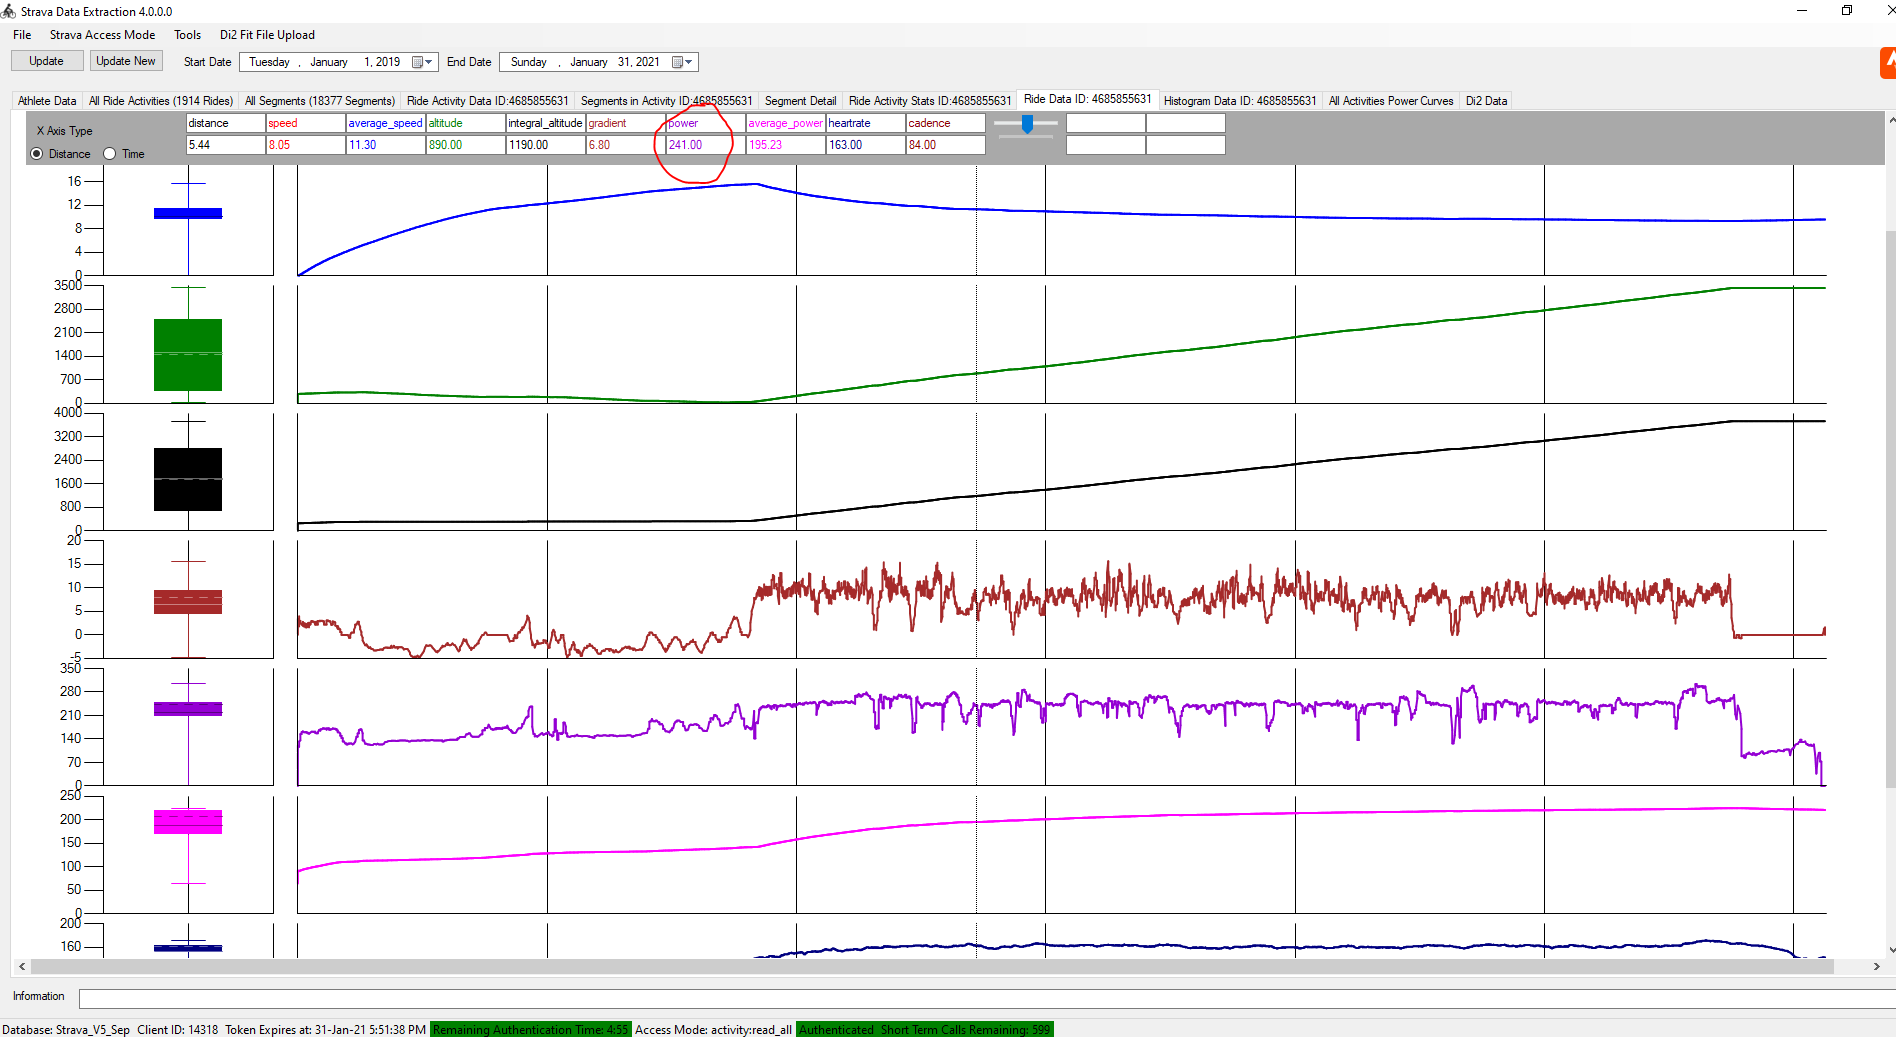
Note the FTP values I have achieved is not a specific FTP test but processing of the continuous data. Here's that data (again from my tool):


Power is in Purple and you can see the scale from the screen shot - I managed to hold ~240W average all the way up apart from the corners

I moved on from my laptop and recycled an old desktop I had to put in the garage with twin monitors and new shelves:


After a week or so of using my laptop (whuich was only just up to the job I recycled an old desktop I had (with an Intel Core2 Quad Q6600 @ 2.40GHz processor and a NVidia GTX460 graphics card). I thought this was going to be up to the job but it was only a bit better than my laptop. I have since replaced the desktop with a Beelink U57 Mini PC (from Amazon here) with Intel Core i5-5257u Processor and Intel Iris graphics. This is better than the desktop but the key thing is that running Zwift it only uses 25W vs the 125W plus of the desktop.


Here's the same view in my garage but with the Beelink:
 

 It's hard to spot the Beelink unit sitting on the shelf. I'll probably swap out the 2 off 17" monitors for 1 off 22" for the Zwift screen and an old 15" for the "other" stuff like Netflix etc
 
In terms of CPU performance this little box has the Core 2 Quad licked (data from https://www.cpubenchmark.net). The Beelink also has an M2 SSD and that is really fast:


The graphics performance differences are less clear (data from https://www.videocardbenchmark.net):


However in real life staring at a monitor whilst dripping sweat its difficult to see any difference between this Intel Iris and the GTX460. This is using the 1080p setting from Zwift. I think some of the quality settings are on the lower side

So at the moment I'll still be paying to ride Zwift and looking to get better performance out of myself as a result. 

And as well as the Zwift subscription I have bought shelving for the garage and a new computer - so much for saving money

Sunday, 27 December 2020

Fit File Reader and Converter to Text - FIT to CSV

 Fit File csv to Text Converter V1.0

I've been writing a number of Window Applications in C# using Microsoft Visual Studio over the past few years. This is mainly to keep my brain active and develop my software skills

I wrote a few small applications to try the software and workout what to do but really started making some progress when I started to develop an application to download and process my Strava data. There's a number of posts on this Blog about that including the latest version (which is here). This development goes in fits and starts as it's more of a winter/dark evening activity - the rest of the year I'd rather be cycling and generating the data than processing it.

I have also written a TCX file reader which is (here).

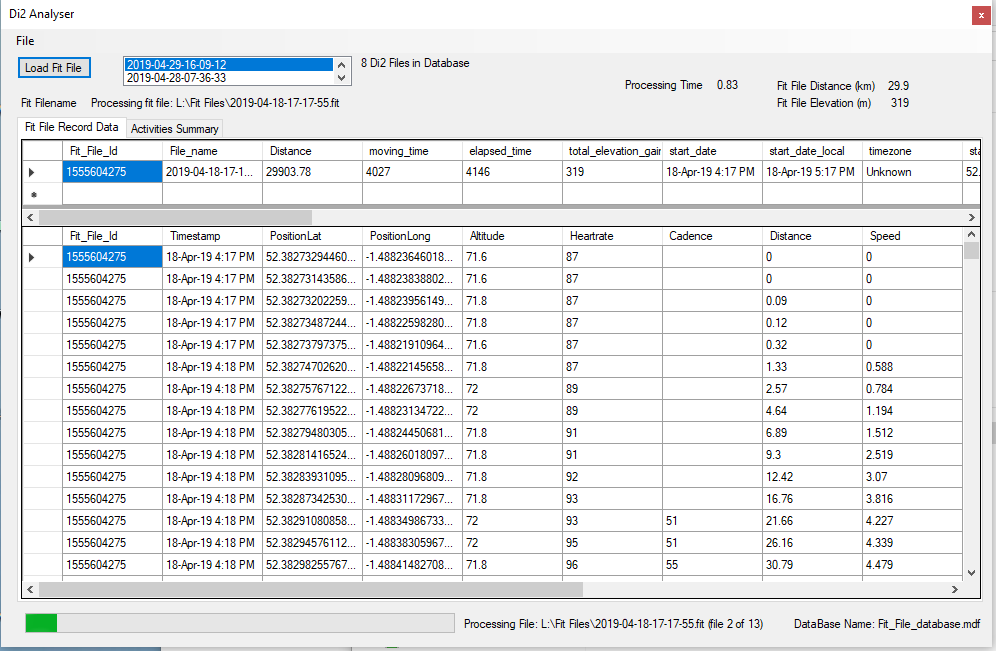
More recently I used the Fit API to process the .FIT files generated by my Garmin. This was primarily to get the Di2 shift data from the file that is not readily accessible via Strava or other tools - although the website https://di2stats.com/ does support this. This desire to see my Di2 data resulted in my Di2 Fit File Analyser, and the latest version here here

The current aim is to integrate both the TCX and FIT file readers into a single application alongside the Strava data so providing a one-stop shop for the main cycling data file formats. Then I can use this application to analyse and display the data from various sources in tabular, graphical and statistical formats

As I am not a software developer by training, I can write software but it's a bit ad-hoc and made up as I go along. This has made some of the applications quite difficult to support and develop, so I have decided to restart to an extent by re-writing the Di2 Fit File anlayser just to read, store and export fit files. I have attempted to code it better in away that supports easier development and maintenance. I'll then add in the TCX file format before integrating the Strava data and this release is the first attempt in that journey. However it's often 2 steps forward 1 step back as I try to learn how to make better code, and although it's a lot better in this version compared to the Di2 version it's still not ideal

The "Fit File Tool" in this release does nothing other than read fit files, store the data in a SQL database, display the data from the file along with a summary of that data, and allow an export of the data in csv or Tab seperated format. 

The application can be downloaded here.

What it Does and Assumptions

On installtion it should add a Start Menu shortcut and open the application:


During the first instal it should create the SQL data base in the Application folder and you'll see a window as below (note that the list box displayed here will not be present)

You can open the folder where the application has been installed by Selecting File and "Show Working Folder":


The working folder will be in some obscure location (I have not yet worked out how to install in a nmnore sensible location):


To process a data file simply press the "Load Fit File" Button, browse to a location where they are situated and press OK:


You can load multiple files at once if required. I have loaded 332 files in a single operation with no issues

During the processing the data for each Fit file will be displayed once processing is complete, and a progress bar will be displayed:


Once all the data is loaded you can select any file from the List Box or just reload it.

Right clicking on the data display will allow it to be exported:


Other Information

  • Depenfing on ride duration and number of sensors it takes from 1.5-10 seconds to process a fit file on my system
  • All data is stored in an SQL database.
  • The database is called "Fit_File_datrabase.mdf"
  • There is no option to define an alternative databse name or storage location
  • All data is stored in 2 tables - one table is for the record (time stamped data) and the other for storing a summary of the activity data
  • The record table has columns for all time stamped data defined by the FIT standard. I can only test this with the cycling data fit files I have
  • Whilst the database can store all fit data it only displays columns with actual data in it
  • The activity summary data is as per the Strava Activity Summary data for future compatibility (see abvove)
  • There is some processing of the record data:
    • A unique identifier for the fit file is created (to be equivalent to the Strava Activity Id). This is created by converting the file name to a true date and time value and then converting this to the Unix Epoch. For a single user this should be unique
    • The Latitude and Longitude columns are converted from the Garnin 32 bit number to actual longitude and latitude
    • Sometimes the data stream for a column is blank from the original data source
    • If the Speed Column contains blank values these are set to 0
    • If the Power Column contains blank values these are set to 0
    • If the start of the Latituide/Longitiude colums are blank the value of the first non-blank row is filled in from row 0 to that row (assumption is that the GPS has not synched)
    • If the end of the Latituide/Longitiude colums are blank the value of the last non-blank rows  arefilled in from that row to the last row

It's been tested reasonably well, however it's by no means a professional piece of software. If problems occur then turn logging to "Ultra" from the file menu, and load a single file. Then review the file "application.log" in the Working folder and contact me via this Blog


Sunday, 1 November 2020

What did CoVid 19 meant for my cycling in 2020

(Updated 1 Nov 2020)

Firstly under no circumstances is the post ignoring or dismissing the seriousness of the CoVid19 Pandemic which, at the time of writing, is far from over and looks if we are entering a second wave at least as significant as the first wave back in March 2020

Fortunately so far my self and my family seem to have got through with minimal major disruption and health impact which is a huge bonus

I've also been fortunate to have been in continuous employment, almost as normal for the duration so far although with some pretty small changes in the scheme of things

Just before the lock down started we had moved to start putting some people on  furlough and getting those that could to work from home. We also moved those remaining on site to a double day shift pattern. The result was that we could maintain a level of Social Distancing whilst working to keep some key product development running to meet key milestones.

The outcome for me was that I was working and running my team as normal but on a shift pattern of 6.00 to 13.45 (early shift) and 14.00 to 21.45 (late shift). These were also modified shift patterns to avoid conflict at the normal shift changeover. I have worked shifts a number of years ago and would rather not have been doing them as it's hard work, and disruptive to sleep patterns if nothing else. What I wanted to take from that earlier experience was that I did not get up and "wait to go to work" on the late shift, and did not get home from the early shift and fall asleep, meaning I was unable to go to sleep in the evening for the early start. 

Fortunately the UK Government allowed one session of "individual daily exercise". The exact definition of what that meant in terms of duration and distance from home was not fully clear, but I saw it as I could ride my bike, on my own and as long as I avoided other people I would meet the requirements. Whilst I rode for more than an hour I did tend to keep closer to home that I would normally by choosing routes than looped around my house or rode out and back several time like spokes of a wheel. I certainly reduced the number of rides that went more than 15-20 miles from my house, conscious that if there were any issues it would mean that my wife had a longer (and probably what would be classed as non-essential) journey to rescue me if needed. Fortunately that didn't happen, and I started taken an extra inner tube "just in case.

So as a result of the shift pattern, desire to not sit at home, and good weather I started riding for 1-2 hours per day. This was made more attractive because there was almost no traffic. I have ridden some closed sportives and at times it was like riding on closed roads

Shortly this became a habit and without really realising it I was racking up significant mileage. I was also riding on new roads and finding new places to ride that I'd never seen before in 1o years of riding in the area

The following are some of the changes that I saw, in no particular order:

  • My average weekly mileage rose to 220-250/week
  • I completed the Strava 1250km/month, Climbing challenge and Grand Fondo 3 chalenges months in a row (I had only completed all 3 in a month once before)
  • Despite the high mileage the altitude gain was relatively low as I was staying closer to home and the "bigger" climbs are further away than I was riding
  • I had to change the chains on my Giant and Scott about 6 months earlier than expected
  • I needed to buy some more cycling shorts (as I was wearing the ones I had so often and the laundry couldn't keep up)
  • I rode 11 consecutive days in a row in June
  • Typically I rode for 24-25 days every month in April-June
  • By the beginning of September I had achieved my 5000 mile "target" and by the beginning of October I'd already done more miles that all other years bar one
  • My average speed is higher on both my "good" bikes in 2020 vs 2019
  • I have only ridden (commuted) to work about 4 times in total this year (vs. probably 30-40 normally)
  • It was difficult to get spare parts for bikes such was demand
  • The spare parts that were available were a lot more expensive that normal
  • I have never seen so many cyclists on the road before (outside of a Sportive)
  • My average speed increased by 0.2mph on both the Scott and the Giant
  • The Velo Midlands was cancelled with no refund - robbing b******s, I won't be doing any of their events again
  • We had to cancel (defer for a year) the cycling holiday to the French Alps. I wanted to go this year at least as it would be the last year of everything thing being "normal" before we leave the EU at the end of 2020
  • I had to join Strava Premium as the changes made to the free version removed quite a few things I liked (like segments). Although this was not CoVid related to be fair.
  • Now that I'm a Premium Strava member I have used the Live Segment feature on my Garmin, and it has surprisingly made a difference. On segment
  • I used more Contact lenses than I have ever used before in a given period. I saw that I could now recycle both the plastic cases (which I did anyway) but also the foil covers. So I've been keeping them ready to recycle next time I go to the opticians:

Used Contact Lens holder mountain:


Here are some images and data showing what I have cycle this year so far: 

Saturday, 18 April 2020

Di2 Fit File Decoder V1.1.1

Di2 Fit File Decoder V1.1.1 - Another Update April 2020

This is a small (traditional) Windows desktop application written in C#/.Net to decode a .fit file and extract the data from Shimano Di2 Gearshifting. This gear shift data is monitored using (in my case) the SM-EWW01 unit connected in series with the normal cable routing:


The application was started because I want to plot the gear data in my (much bigger) Strava data extraction tool, so the first step was to get the data and understand it

The fit file format information and sample C# code came from the Ant+ working group (Link) - you need to register, but it's free.

Using the sample console code to decode a fit file I was able to build a simple Windows application to get the gear shift data ("event data"), and the time based data (i.e. the "record "data). I then plotted this data against time/distance in  aline chart, displayed it in a data table and created a simple bar chart/histogram plot of the distribution of time/count in each gear combination.

Version 1 used file storage and V1.1 used a SQL database (as I was more familiar with these having used one for my main Strava Application. I left the code at V1.1 for a while whilst I went back to the Strava application and made some further updates. These were mostly in improving the code quality and readbility based on some learning that I gained from this Di2 application.

However this got the Strava Application up to a better level so I went back to the Di2 Application again to make some further updates to make it easier to bring the relevant code into the Strava application. This includes
  • finding why the database size was so large and fixing it to an extent
  • general minor bug fixes
  • some UI improvements
  • allowing the user to select pre-saved data from the Database and displaying it
  • ability to load and process multiple files simultaneously (i.e. select a whole directory of files)
  • a new feature to display a total time/count bar chart for shifts.

The Application can be downloaded from here (It's an installer file)

The other posts about this software are:
First Release: Here
Second Release: Here

Sunday, 29 March 2020

Strava Data Tool Update March 2020 - V3.1 - Released

As posted a few weeks ago I havce now "released" V3.1 of my Strava Forms App

Updates include:
  1. Segments.
  2. Continuous Updating consdering the Strava Rate Limit
The code can be downloaded here (its a Windows installer)

1. Segments
This version sees download and processing of Segment data. It will display a table of all Segments ridden by the Athlete. It will also display the segments ridden during a particular Activity. Double clicking on the row header for a segment will show all the ride times for that segment vs. date

Here's some screen shots to show this

First the Segments for the Athlete:


Here you can see that I have ridden 1683 Activities (Rides) and furing those rides I have ridden 16232 UNIQUE segments. This table will show how many times each segment has been ridden


The table show the segments by name but can be sorted in the normal way by double clicking on a column header. I.e. :


These are segments on my commute hence the high number of times they have been ridden.

Note that some segments seem to be uploaded to Strava with no name (i.e. the name is 0 characters length). These are identified in Strava with unique IDs, but at the moment this application renames them to "** Unnamed **" and groups them together:


Then the Segments for an individual Activity are displayed when an Activity (individual Ride) is selected (double click an activity row header:


Finally the history of a segment can be seen by double clicking on the row header for a segment selected (Uniion Road in this example):


The segment data is downloaded when the the data for an individual activity is requested - i.e. when you either use the menu option "Tools / Download all Activity Data" or an individual activity is selected by clicking on the row header for an activity (as normal). Therefore when starting the Application for the first time there wil be no segments displayed until some activity data has been selected. The Segment tab should update when segments are updated but I have seen inconsistent behaviour here. Closing and restarting the application will force the data to be shown

2. Rate Limits
Strava imposes rate limits for downloading data. This is 600 calls every 15 minutes and 30000 every day

For this application the daily 30000 limit is not an issue it would seem - even heavy use sees not many more than 5-6000 calls per day. However the 15 minute limit is a limiting factor. When using the "Tools / Download all Activity Data" option it will keep making calls until all the data is downloaded. On my system it is not unusual to use this low limit up in 10-12 minutes. The repsonse once this happen is to call an exception which stops the downloads. 

This has now been addressed. The limit is continuously monitored. When it is exceeded the download code loops every 20 secs waiting for the limit to be reset (it happens exactly on the 1/4 hour) and then continues untill all data is acquired.

The balance of calls remaining is displayed in the toolbar:


You can leave the download running  quite happily and it will continue until complete - ihave downloaded all 1630+ activities that I have uploaded several times without issue. It uses 2 calls per activity to download.

Other comments
  1. When the application starts first it checks whether or not it needs to authenticate, and does so if required
  2. It then loads all the data which can take 10-15 seconds
  3. Whne first looking at the Activity (Ride) list it may seem to freeze as it is identifying whcih activities have downloaded data and painting them blue This can take 5-10 seconds

Other changes:
  1. Many more small code "improvements" and tidying
  2. Some changes to make the GUI a little more responsive in a few areas
  3. Some other small improvements and minor error checks
  4. Previously there  has been no check if using a later version of code with an older database version. There are occasionally changes to the database. It now checks if the database is the correct version and aborts if not. In this case you need to delete the .ini file and start again as there is as yet no database upgrade tool

Next Steps
  1. Update the database table creation code for the last 2-3 tables (make sit easier to create the database tables and create DataTables to load data to and from the database
  2. Add Di2 data (from a .fit file)
  3. Continuous small improvements

Sunday, 15 March 2020

Strava Data Tool Update March 2020 - V3.1 - Segments Added

Just a quick teaser for a soon to be future release - the application now reads the segments ridden during an activity, and is able to plot out the riders time performance over all occurences that the segment has been ridden

First the Segment list for an activity:


Note that the elevation gain is the maximum less the minimum gradient (so does not account for dips in the segment) - but Strava does not give this data in the segment summary (may be better able to be calculated from the segment stream data when I get to that point)

And here is my historical performance over all the occasions I have ridden the segment (in a time period):


There is more data that I will add here - statistics of the time,a histogram perhaps etc.

The biggest issue though is that the additional Strava Request traffic to get the segments now means that I can only read about 200 activities before the 600 Requests limit per 15 minutes is exceeded

This means that I have not yet been able to read all my 1700 activities into the database with the segment data, so I am going to need to take some other approaches in the workflow to work within the limit. When this is fixed I will release this next version.


The good news is that given all the work over the past few months I spent "improving" the code, this was actually only ~5-6 hours work to get this into a pretty robust state

Friday, 6 March 2020

Strava Data Tool Update March 2020 - V3


There's been a lack of visible progress on this application for 6-8months

This is partly because:
  • the weather was good over the summer and I'd much rather be outside
  • I've written the Di2 decoder application for a change of programming focus ("a change is as a good as a rest")
  • and I have also been making significant changes to the Strava Data Tool "under the bonnet" based on learning from the TCXConverter and Di2 Decoder apps that I wrote and could see benefits in making it easier to mainatin the Strava Tool
  • The Strava tool grew organically making it a nightmare to edit and change the code - this is because I wrote it learning as I went and adding feature ad-hoc and hence there is no design to the code
However the dark winter weather meant that I have been back on this with quite a lot of effort over late 2019/early 2020

I also thought ready to release back in February 2020 but some last minute tetsing showed a major issue when creating a new database. It took me a long time to work out the change that caused this, which was in fact trivial and related to changing to a static SQL class and getting confused with the constructor behaviour

Although the app looks almost identical there is a big change list which includes the following (not-exhaustive) list
  1. Only raw data stored in the database (~60% reduction in database size and improved performance)
  2. Use of SQL_BLOCKCOPY to load data to database tables)
  3. Consistent use of DataTables throughout the app, and programmatic creation of these rather than predifined. Also the Datatable definition are used to programmatically create the Database tables menaing a much greater level of consistency and alignment
  4. Conversion to static for a number of common classes
  5. Introduction of a static Global_Constants class to improve maintainability and readability across the application
  6. A lot of code tidying up
  7. Removal of redundant methods- so the code base is now smaller

  
There's still a lot of improvements to be made:
  1. The most major issues seems to be a change with the authentication process that is less seamless than it was a few months ago - I have yet to resolve this. When you start the application for the first time it will open a web page asking you to approve access to (your) data. This is as designed. However if you then close the application or don't use it for a further 6 hours the application needs to re-authenticate - this is as required by Strava. In theory th eapplication should use one of the tokens set in the first initialisation and silentrly re-authenticate. However it doesn't and it throws an exception "Error #3000 during Web POST, Authentication_Web_POST/Get_Tokens". However if you select OK it will then open a web page and re-authenticate. I need to look at this more
  2. Some database tables still need "re-formatting" to the new process
  3. Lost the ability to export the graph as an image (as I changed how the export feature worked)
  4. Better logging format and verbosity - although its better, it's still a mess
  5. More testing and error trapping - again it's a lot better but still not exhasutive
  6. The redraw code still does not function correctly
  7. Further code general improvements- readability, structure, style etc.
Some features to be added include:
  1. Adding the ability to (manually) load di2 data from a .fit file and asscoiate with existing down loaded data, inluding the statistics and graphical displays (i.e. incorporate my Di2 Decoder application into this application
  2. Adding segments data
  3. Refining the statistics - I think allowing a level of user query building would be good (to an extent). Also getting data per bike and ride type for example - i.e. how many miles in 2019 on Bike X on a trainer
  4. Fixing some of the things athat are still broken

Anyway here are the links to the program
  1. The standalone .exe file is uploaded to here:Link to V3 standalone exe Zip file
  2. The installer package is uploaded to here:  Link to V3 Full installer - Recommended


I strongly recommend using the installer - its been tested and works as I expect it to

As far as I can tell there are no viruses in the zip and there is  no spyware - it just reads your Strava data

Best Help page is here: Notes from release 2.0.0.0


Saturday, 15 June 2019

Strava Data Tool Update June 2019 - V2_1_1_0_67

The latest version is here: Strava Tool V3

Please use this version

Update 15 June 2019

I was using the tool recently (having not been for a while) and seen that some activity data (that is the second by second data) would not or could not be uploaded to the database

I have now identified the issue and resolved this.

Get the latest version here: Link to V2_1_1_0_67

As an observation when getting All Downloaded data (in this case 233 activities) it took 16 minutes - this is a rate of about 15 a minute, so please be patient if you have 1000's of activities

Saturday, 4 May 2019

Stava data Tool

The Latest Version is here: Strava Tool V3

Please use this version 

This is a page as to how to install, set up and use my Strava Data Extraction Tool.

First get the installer files from here. Extract the files from the zip file and you should see these files:


Double click on Setup and the application should install correctly. It might even auto run - I have had inconsistent behaviour with this. Also for some reason the application is called "Strava Forms V2.exe":

I say "for some reason" but obviously I have not packaged it correctly. You could create a shortcut for this t make it easier if you wish

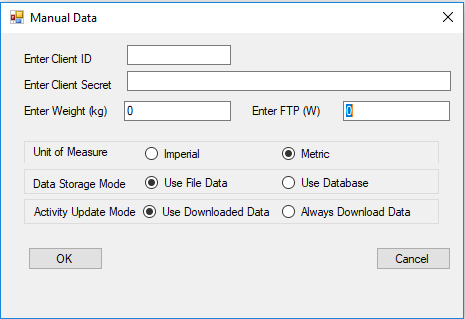
The program uses an old fashioned .ini file for configuration data. If this is not present (it won't be for the first time its run) it will open the configuration dialog box as follows:


You will need to enter the Client ID (use application identifier) and the client secret as a minimum. The application will check if you have not and keep the window open. This is also the case for the Weight and FTP entry boxes

The check boxes need not be altered if required. These settings are as follows:
  1. Unit of measure - default is metric, can be changed to imperial (statute). Note this is effectively a one-off setting and I don't think (I have not tested) that once the application is running it swaps between the 2 as required. This is a future development, it might work for database mode but definitely not file mode
  2. Data Storage mode - default is File based data, can select Database (SQL). I would recommend Database mode as I have done more work with this option and will do more development using the database
  3. Activity Update Mode - can save bandwidth and time - Use downloaded data means if that data already has been downloaded it will use this data, else it will re-download the data again.
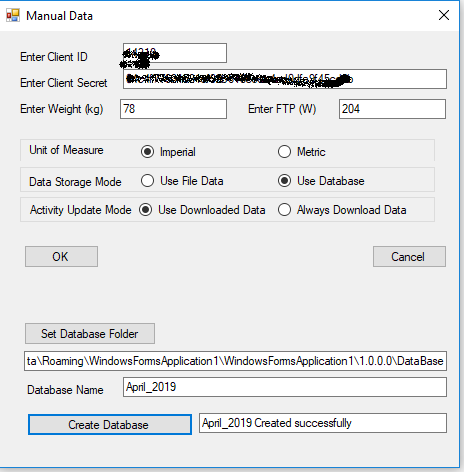
If you select "Use database" the dialog box will increase in size and options to create a database will appear:


Here you must select a folder and specify a name for the database (note please do not add any file extension, just a name) as follows:


Then select "Create Database" and all being well you will see this:


Once you press "OK" the application has enough configuration to start. It will initially try and Authenticate and you will see the following:


Note the Access mode is selected as "activity:read_all". This is the default option and will not allow you to read activity data if this is not selected. The application will connect to the Strava authentication process immediately and all being well a web browser window will open which you need to accept (or not):

Press Authorize and hopefully the the web browser window should automatically change to something like the following:

This is part of the returned authentication data and shows the current access token (there is other data returned that I did not show). It is this code that will allow access for the next 6 hours. The status bar data updates and will now look something like:

You will see that Athlete data has been obtained and displayed. The status bar now shows when the current token will expire, how long is left and that fact that it is authenticated.

In theory, before the 6 hours is up it will re-authenticate itself automatically. This is not tested.

The application data folder is set automatically by the installation and is in a place almost impossible to find. There is quite a lot of benefit to opening this folder so the application will open it for you on demand:


The "Show Data Option" will open the folder. The other options will be described later.

Note that the application does quite a lot of automatic information and error tracing. This is a file per session called "Traceoutput_YYY-MM-DD_hh_mm_ss.txt" and is created in the Data Folder. These can be useful in the event of issues. These can get quite big.

The next step is to download the Activity Data - this is the summary data about all the activities that have been uploaded to Strava between 2 dates. The default start date is an arbitrary 1 June 2018 and the end date is today's date. These are standard Date Pickers so can be changed.

Select the start and end dates of your choice:


And then press the "Update" button. Depending on the number of activities it will take some time to get and process the data. The application is unresponsive during this period and it cannot be stopped. Once the data is downloaded and processed you will see something like the following:


There will be a graphical display of ride count, distance, elevation and activity duration against date. This is also tabulated and a summary of the distance on each bike is also presented. Note that this is only the summary data of the activity - NOT the time based data recorded during the activity. To get this select the tab "All Ride Activities (nnnn rides)". nnnn will depend on how many rides you have uploaded:


This will show the summary data for each ride (newest first). Black text is that none of the time based data has been downloaded, blue text shows that time base data has been downloaded to the database and red text shows that time base data has been downloaded to a data file.

To get the time based data select the left most empty column next to the activity for which you want the data and double click:


This will down load the data for this activity and it will be shown in the other tabs.

The raw data is shown in a textual format in the "Ride Activity Data ID:xxxxxx" tab:


More detailed statistical analysis of the data is shown in the "Ride Activity Stats ID:xxxx" tab:


The data is presented graphically in the "Ride Activity Graph ID:xxxx" tab:


Histogram data is presented in the "Histogram" tab:


It is possible to automatically download the time based data for all activities. From the menu Bar select the Tools menu and select "Download All Activity Data". This will the download all the time based data and process the statistics. Note - this is slow - you can expect an hour or more if you have many 100's of activities. There is a progress indicator and the application is partially responsive during this task:


Note that bandwith/number of requests is limited for this sort of Application. I have not implemented code to check this and ensure that it pauses when the limit is approached. However in my experience I can set the application to download all the data and it will not fall over by hitting this limit.

You can review the rate on your Strava "My Application" page from the settings page:


Note that there is a LOT of data needing to be stored when you select the option to download all the data. The application reads the raw data, which it stores and it also writes the imperial and metric data in the database as well (to save time when viewing the data). I have ~1500 activities and the SQL data base is ~1Gbyte in size to store this, so please be aware.

There is an option from Tools Menu to view the database size:


You can also remove all the data from the database using the "Delete All Rows" button - use at your peril as you'll have to download it again!

MORE TO FOLLOW