I first rode Horseshoe Pass back in September 2015 when we went to see the Tour of Britain in Wales - I wrote a few words about it here. This time we went on the Railway at Llangollen just after the August Bank Holiday.
Here's the picturesque station from the bridge
After we had ridden the railway and had some lunch and I rode the Pass again. We'd parked about 1/2-3/4 mile up the road from Lllangollen towards the pass so I rode back into the town and beyond before doing a U-turn to ride back up. I'd forgotten that the steeper sections were between the town and the cattle grid, after which it was a lot steadier, and whilst I was not overly fast I felt nowhere near as stressed on the climb as I had previously when I had very little warm up and was on the limit. In fact I felt pretty good and was riding well in my comfort zone and felt faster than the previous time. The hairpin came up sooner than I expected and I had some effort in reserve so I pushed harder at that point all the way to the Ponderosa cafe Here's a video of the climb and descent:
This time I remembered to start the camera in Llangollen so its the full climb.
Despite feeling faster than the first time I was slower everywhere except the segment approaching the summit. I was a bit annoyed as I had some left in the tank and should have gone faster everywhere.
If I ignore being slower than the previous time I was happy with my power numbers - a high average and high Dr Coggan value (weighted power in Strava speak):
I have been happily progressing thinking that a few people might have downloaded my app and used it. I had no feedback but this does not mean its not being used - it could just as well mean it is being used and works as intended or did not do what people wanted. In reality I have written the app for myself as a learning and intellectual activity However I was recently looking through the comments on this Blog and saw a comment saying: "Just quickly tried this and got the following error:Downloading http://i5desktop/Strava Forms V1/Strava Forms V2.application did not succeed."
I had not realised there were errors deploying/installing but on reflection could see that I had never tested the installation using the zip file downloaded from my google drive. When I tried myself to deploy the zip file to my laptop I got the same error. I have done a bit of googling and there are some restrictions and limitations when deploying using Visual Studio Express However I have taken a slightly different approach and believe that there is now a zip file that will allow installation of my application.
It can be found here: Google Drive Link - the latest deployed version is 2_1_1_0_53
I can't be 100% sure that it will deploy but I am much more confidant that I was before.
There are a number of incremental changes and improvements since the last "release" - the biggest is probably that there is now a trace logger that I have been developing so I can identify and address issues that don't appear in the IDE. This is found by using the Menu option "Tools" - then select "Show Data Folder". In this folder will be files called e.g. Traceoutput_2018-09-01_11_50_09.txt - these are reasonably verbose and help debug and diagnose issues
However the software is very much a work in progress and I have a big list of things to do still When installing you may get either of the following warnings (you probably will as the application is not signed in any way)
Please note that I have written this application for my own use and as far as I can tell it only does what it is meant to - acquire and display Strava data. Should anything happen to you PC whilst installing or using this then I cannot and will not take any responsibility
By chance I found out that the famous Silverstone Motor Racing Circuit opens its doors on a few evenings in the summer for cyclists and runners to use the circuit for £5. I have ridden at Donnington Park and Mallory Park previously and its a great experience to ride on a closed track, so I aimed to ride Silverstone as well The details are/were here: http://www.silverstone.co.uk/experiences/running-cycling/running-cycling-club/ Silverstone is just over an hours drive away for me and I was able to ride on the evening on the last Wednesday of August when I took some Annual leave I arrived and was ready to ride about 10 minutes after the track opened and rode 10 laps - that's 36 miles in 1hr 50 minutes. I averaged 19.8mph with an average power of 185W. Given the strong wind that evening (helped in some parts and was a struggle on other parts of the circuit) I was very pleased with that although I would have liked to average 20mph. My first lap was my fastest at 10m13s - an average of 20.8mph and 213W power. All subsequent laps were slower - there were more people on the track by the time I completed that first lap but its very wide and the number of people did not really make a difference. Whilst I was no quicker for the remaining laps I managed to be reasonably consistent which I saw as an achievement as well
The surface is excellent - fast, and very smooth. Its almost flat - over the 36 miles I climbed 787 feet only. The biggest issue was the wind - it was a windy evening and whilst it helped from the first right after the pit lane down to the most southerly part of the track it was a real slog back up and the cross wind along Wellington Straight was certainly an interesting experience with my deep section wheels
I was hoping to try and get in a bit of a train to get some good speed but the fast people were faster than me and there were no real trains formed. It was a great evening - it shows that cycling crosses all classes and people - children to pensioners, tag alongs, trailers, stabilisers, elec-assists, recumbents, mountain and hybrid bikes, road bikes and full on TT bikes were everywhere and everyone was enjoying it it seemed. I would absolutely do it again - highly recommended Here's a video of my 1st lap:
I always enter all the Strava Monthly Cycling challenges. Generally I complete the Grand Fondo Challenge (100km) and in the summer months the Climbing challenge but in all the years they have been running I have never achieved the Distance Challenge at 1250km 1250km is a huge distance and subsequently requires a huge time commitment as well. On a few occasions I have ticked just about 700 miles so just over 75% but never got anywhere close.
However August 2018 will go down in my personal history as the month that I completed all 3 challenges as I rode in total 830 miles. Here's the email from Strava confirming the completion of that elusive challenge:
And here (from Veloviewer) is the proof of all 3 being completed:
The sense of achievement was immense and I had a real sense of pride
I am not sure quite how I did it but an element was consistent cycling throughout the month and a lot of cycling to work. With the prolonged good weather in August and favourable work requirements I was able to ride commute 2-3 times each week - riding on 3 days to work and back gives me 110 miles in that week. Looking at my Veloviewer summary for August it shows that I only didn't ride for 9 of the 31 days in August:
I also managed to squeeze in a number of longer (60mile+ rides over the weekends and I took 2 additional Annual Leave days over the Bank Holiday weekend. All in all this provided the time to actually churn out those miles However the down side is that I am absolutely knackered as a result and whilst I have ridden another 180 miles in the first week of September they have been really hard and tiring - I am going to need to slow down a little in preparation for the Velo South event (100 mile closed roads) that is just 2 weeks away I am not sure I'll be able to do it again until I retire and have the time to do so!
Cycling with Power The shame - I started measuring power as part of my cycling and its escalated! It really started at Christmas 2017 when my wife bought me (partly as I suggested it) a Tacx T2240 Flow "smart" turbo trainer with power measurement:
Tacx Flow T2240 Smart Turbo Trainer
Electromagnetic resistance unit
Train by connecting to the free Tacx app or other third party software (i.e. Zwift or Trainer Road)
Connect wirelessly to apps via Bluetooth or ANT+ for automatic resistance adjustment
Connects to your smart phone or other device wirelessly by Bluetooth or ANT+
Maximum resistance: 800 Watts
Simulates a slope realistically up to 6%
Behaves as a fluid trainer when used independently
Includes Tacx Skyliner riser block
Requires a power source for smart functionality to operate
Bluetooth 4 or higher required
It was on a good offer from Halfords and with my British Cycling membership you get another 10% off as well with is always worth having. I had (still have) a very basic Tacx turbo trainer from the late nineties that I only used when the weather was rubbish. I have not written about it explicitly but I partially dismantled it and showed how it worked here: How does a turbo trainer work? During 2016 I had started to ride it a bit more than in any previous years, however it was boring and tedious and my mileage was limited, although I was counting the miles towards my annual target. I didn't do any formal training on it though - just used it as a work out and at best probably ran up to a heart rate target. I'd not explicitly wanted a "Smart" trainer (and this was really well before Zwift took off) but wanted the power numbers to give me something to work against and as a comparison of sorts with the Strava Estimated Power numbers. Initially I controlled the device with the (Android) app on my phone but recorded the data on my Garmin. The Garmin recorded all the existing sensors and saw the Tacx as a power meter so this was easy. However the App was at best picky and at worst inoperative. The App can be got here (for Android): Tacx Training. There are some other Apps as well including one Firmware updates etc Here's the App page:
And here's the rating:
You can read into this yourself the quality of the App! When you start the App it implies that you need to create an account. However look closely and there's a Skip option, This means that you can't save the data from your sessions with Tacx but you can of course save it on the Garmin. I initially had a lot of issues making a reliable Bluetooth connection between my phone and the trainer, but some forum browsing suggested that with the trainer power up, you turn Bluetooth off on your phone. Then you turn it on again. Doing this meant that a connection was made ~90% of the time. If it didn't connect then it took numerous attempts to connect. At least you could warm up on the turbo whilst doing this. Once connection was made you could run in constant power mode (my choice) and periodically change the power setting. This was not ideal with sweaty hands and I did a lot of searching for a PC based turbo training tool. There are a surprising number of these. There are the paid for models like Sufferfest, TrainerRoad, and now Zwift which are the big 3 I guess. There are a number of free applications as well, some of which seem pretty home made, or infrequently supported etc. typing into Google will give 100's of hits for software and reviews. However I stumbled upon Veloreality. It sells itself quite strongly on high quality videos (that you can buy) so you can "train" on real climbs. The software is free but the videos cost the money. They also sell a matching cycle trainer if that's what you want. However what's not clear on the website is that you can also "build" your own training sessions in the software - i.e. make a power vs. time profile and ride something like the Sufferfest sesstions. I think on the Videos that you can race against other people via the Internet as per Zwift. Here's the actual list of features:
Velo Reality – Lynx and Lynx II
Wahoo Fitness – KICKR and SNAP
TACX – Their Smart ANT+™ FE-C line of trainers: Genius Smart, Bushido Smart, Vortex Smart, Flow Smart, and NEO.
TACX – The Satori Smart simulates ANT+™ Power, speed and Cadence, and can also be used.
BKOOL – Bkool Pro from BKool with firmware updated to ANT+™ FE-C profile
Elite – ANT FE-C compliant line of trainers: Real Turbo Muin B+, Real Axiom B+, Real Tour B+
Racermate Inc – Computrainer
Any other trainer that is compatible with ANT+™ FE-C profile.
Any simple resistance trainer assuming it reports power over ANT+™, or in combination with
ANT+™ power meter or with ANT+™ speed sensor and predefined Power vs Speed profile.
The user interface is a bit "odd" and certainly does not conform to any MS Windows Design Guides buts its functional, needs no installation and is frequently updated. I bought an ANT+ Dongle from Amazon - this one, currently £14 (April 2018).
Absolutely no issues with it. I have not connected into the laptop itself but on an extension cable to put it closer to the trainer and bike sensors. This has proven reliable Here's the screen shot of the main page:
There's (from the ANT+ Devices button) a means of connecting to the various sensors and trainers you have:
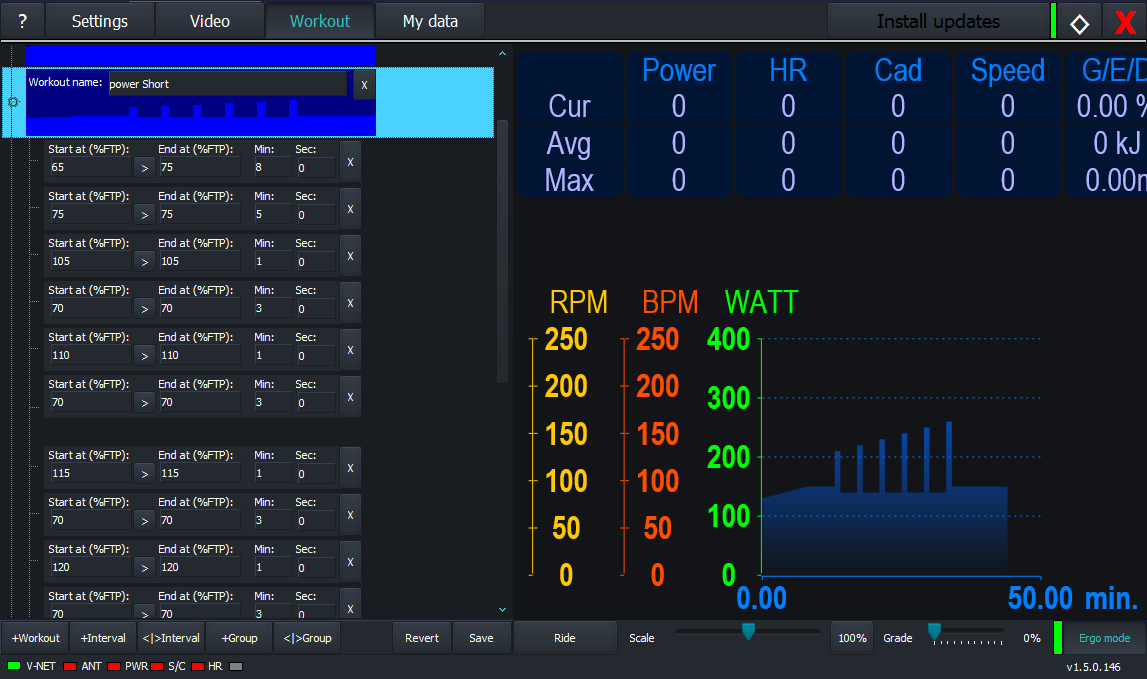
Press Search and they will be found. The only issue I seem to have is that the speed (mph) reads lower on V-Ride than the Garmin - but I record the Garmin data so I am less bothered about this. On the Workout button you can define and ride programmed Workouts:
This shows a stepped rising power ride (1 mins at a higher power, 3 mins lower). The power is a ratio of FTP, My FTP might be 200W on a good day, but it does not really matter - just select a FTP value and then set the % value you want in order to get an absolute power value. If its not right you can scale the whole workout with the slider labelled Scale. In terms of the editor - it could be better - you cannot copy and paste blocks, or create loops. However - its more than adequate. I have created a number of workouts based on copying peoples trainer rides posted to Strava. When riding the workout as I said you can scale the effort level but you cannot pause or skip to the next stage. Despite these minor criticisms it works really well. I rode around 900 miles on my Tacx smart trainer using V-Ride training software - so it can't be that bad at all. I set it up in my garage running from laptop. I have V-Ride running full screen on the laptop - so I can use the keyboard if I have to, and a second monitor running Netflix - so a lot of my workouts are around 42 minutes long - the length of many of the US TV series episodes As well as V-Ride I got on the Beta for "Road Grand Tours" - https://www.roadgrandtours.com/. This is and has been for some time in Beta which seems easy enough to join. This could be a Zwift competitor but s quite a different sort of effort - basically they have created routes that are real (but virtually rendered) climbs - its not videos. This is the log in screen:
Here's the start window:
The rides are Canary Wharf (short and boring), Cap Formentor (completed), Passo di Stelvio (completed), Pienza (not tried), and Mont Ventoux (tried several times but its a beast at (for me) over 2 hours riding) Given the ride time these are not something you can dip in and out of. Although there's a resume function its not at the position you paused at, its at predefined points quite far apart. The graphics are great (but not on my laptop) but you need some decent hardware to get high quality at decent frame rates. There is a set of different camera views. From the website here's what's possible with decent hardware:
Connection to sensors is good and reliable. There are some features like drafting which help. You can upload ride data directly to Strava (its classed as Virtual Ride) The main issue that being in Beta there's hardly ever anyone on the system to ride against - I guess as it gains momentum this will change However this is where I was now in a bit of a dilemma. I am not a power monster but the times on Strava for the RGT segments was poor. If I look at my times on real mountains in the French Alps and Pyrenees I am around a mid-performer - on RGT I am near the bottom. The only way this can be is if my power output is poor - there is no other way that speed is generated
Having got a power meter based trainer this "encouraged" me to try and compare this on the road, so after some consideration I now have a crank based power meter I decided on the 4iiii system, and here are some pictures, both in the "un-boxing stage" and as it is fitted to my Scott:
I rode the Dartmoor Demon Sportive on 5 May 2018. I have ridden very few Sportives over the past few years but this was a Christmas present from my sons. In theory the 88 mile distance did not look too daunting but the 8800ft of ascent did so I was wary and thought I might opt for the medium route at the split depending how I felt.
However I felt good at the split and carried on. All was well until ~70 miles. Two signed 20% climbs in quick succession basically almost finished me, so discretion being the better part of valour I started to (because I needed to) walk some of the steeper hills, although I don't think I could have ridden many of them by that distance anyway.
I needed to stop and the village of Widecombe on the Moor appeared, so I had a can of full fat Coke and then rode on - a few hundred yards further was yet another climb that I walked - uploading to Strava later identified it as #10 - Widecombe - which is the other ascent of Haytor (in turn #9 - Haytor Vale) which I have also climbed I was disappointed that I didn't know it was there but even if I had known and I tried, I would never have been able to ride up it given how tired I was by that point However we had a long weekend in Exeter and circumstances combined that meant we ended up at the top of Haytor and hence had the opportunity to try the climb again.
I rode from the Haytor summit car park to Widecombe - it is about 3 miles with over two miles of "flat" so I tried to get my heart rate up. A free wheel descent to Widecombe, slight push up the climb to the village green and a turn in front of the church and straight back to the climb was the order of the day.
Despite knowing what to expect it. was still a beast - I was just about warmed up and could grind up the hill - on the 34-32 gearing only though. It was tough but I felt OK. It's almost a straight climb with just a small left-right dogleg. I pushed on back to the top of Haytor and then over and down to the visitor centre where my wife picked me up On the first walking attempt I did the following: Time: 13:59 Speed 3.7mph On the second riding attempt I did the following: Time: 9:25 Speed 5.5mph
According to Strava my power meter registered an average power of 232W and a peak of 427W which was probably near the bottom. Here's the same data from Veloviewer
The Veloviewer screenshot above shows a mighty 4.5mph pace at some points
This time put me about 1487th of 4424 (as of 7 May 2018) so just outside the top 1/3 - which is where I have been typically - assuming that I have not not already ridden 75 miles! According to Strava it's 0.85mile long and 530ft of ascent at an average 12%
In the book the "recommended" time is 9 minutes so I ended up reasonably pleased with the effort on this ride Haytor Vale (#9) is a 5/10 and Widecombe a 7/10 - there is no doubt that Widecombe is a much harder climb. I have updated the page on this blog that collates all the efforts I have made on the 100 Climbs series - this is here: https://midlandscyclist.blogspot.co.uk/p/100-gr.html I used my Garmin Virb to make a video here:
And at the top of Haytor my wife took a few photos as I passed by:
Doccomb was part of the Dartmoor Demon and I had my Virb running for this climb as well:
Update of an Update: I have been working through the issues seen when running the application standalone - ie outside of the debugger/IDE. As a consequence I now have a logger implemented in most areas which has resolved a number of the issues - ie it should run without too many Exceptions as I have trapped them or fixed the code. However there are still a number left and there is more work to do here - I realise that I should have done this sooner It is however good enough to have another go at a release which is here: Bristow Strava dot net app V2_1_1_0_34
I have made a few changes since the post below but apart from the logos and the icons its all been about error fixing Note the log file is called "Traceoutput_yyyy_mm_dd-hh_mm_ss.txt" and can be found in the data folder from the menu option Update I believe some people are interested in this - it gets a reasonable amount of traffic. Whether people use the tool or not I am not sure as there has been very little communication about it, but IO have continued to plug away and add more feature. I had a bit of a break with other priorities but have had some time recently This post will also show what's coming up - I was going to release the latest build with this post but when I published it it crashed all over the place (unlike the previous release in December) so I need to do some more testing Here is a list (in oldest order) of all the pages I have prepared for this application. Please read in this order as the text does describe the application etc and how to use it - especially how to create the Strava token that you need to get either the Public or the Private data
Here is some description of the newer features that have been developed: Main (default) tab Added some further Athlete data both tabular and graphical. It shows in a table the annual data summaries for number of rides, and total distance, elevation and time ridden. This is also presented graphically. It also details for each bike and the total, and the distance each has done.
Ride Activities tab Activities for which the data has been downloaded to the local PC are now shown in red:
Ride Activities Statistics tab Enhanced tabular and graphical views
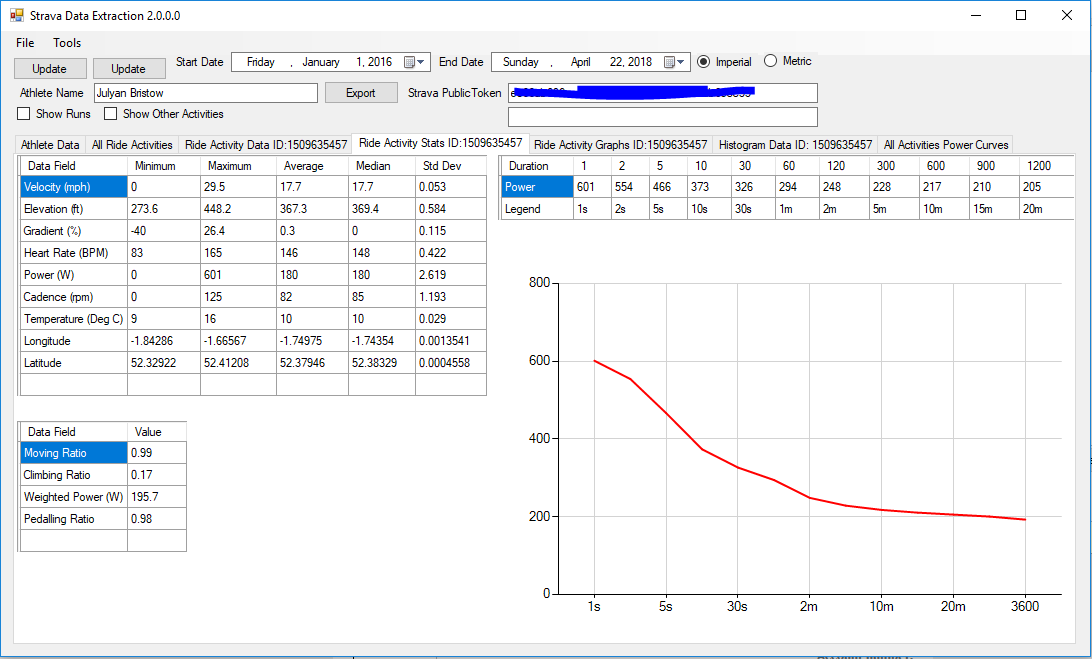
If you have a power meter it will show a power curve - 1 second power, 20 second power etc (not shown if no power meter). The power data is also shown in a table. There is a table for some more enhanced statistics - the "Dr Coggan" power number (if have a power meter) and moving, climbing and pedalling ratio (%age of the total ride time). Some of these come from Veloviewer and some from the StravistiX plug in for the Chrome Browser Ride Activity Graphs tab
The slider next to the data table allows the graph height to be increased or reduced
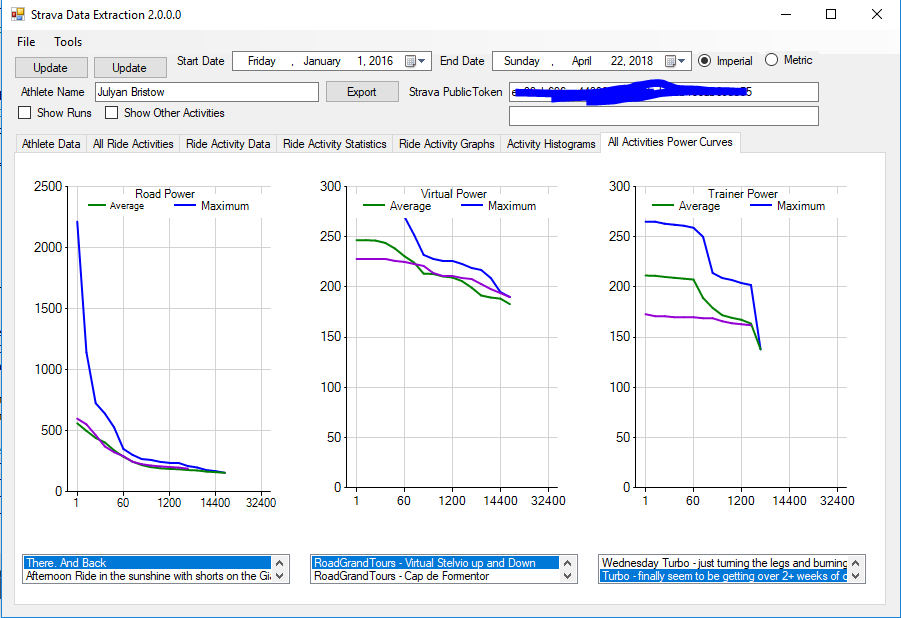
Clicking and holding the mouse over an area of the graph will zoom the x-axis over that region Histogram tab New - shows distribution of data points. Will show Speed. Power (Power Meter data only), Cadence, Heart rate, Temperature and gradient. If any of the data is not present the histogram will not be presented. Dependant on the number of histograms to plot the size and position will vary to give the biggest/best view All Activities Power Curve tab (Power meter data only) If you have a power meter (or a smart turbo that measure power) this will present the data n 3 graphs - one for road, one for "classic" turbo and one for virtual rides (like Zwift etc)
By default the maximum (blue) and average curves (green) will be shown. Below the graph is a list of the rides of each type. Selecting on of the rides will show the corresponding data on the graph in purple Next Steps I have a list of enhancements to make, but clearly to get it to work when published seems pretty important first Once this is achieved next improvements and features include:
Adding manual data (like FTP)
Seeing what else is available as a Premium member (I am not one)
Adding a system logging process (so I can understand when and what issues occur when not running in the IDE) (in progress May 2018)
A lot of code tidying - the more I write the more I see where I can make improvements (has started as part of #4)
Some more statistic calculations
The most important step now is I think to move the data from flat files into a proper database - this is now essential as there are potentially 4 files per activity plus a growing number of application summary files. This in elegant and I can see how using a data base will help manage and use the data. I understand the database process and strategy but I have never done this so it will be a major challenge
Add code to manage the data usage for the API and pause when the limit is close
Allow the system to update since the most recent update and add the new data to the existing data set rather than refresh the entire data set in the selected range
Really try and manage the process to get a Token within the application - the current process is dreadful (although fortunately its a one off task generally)
As soon as I have a version that can be published I will do so